BioNumerics Seven features

Listing all features of our software would be an impossible task. Although the list below is by no means exhaustive, it provides a high-level overview of the BioNumerics functionality. Simply click on a feature to learn more!

ANOVA and MANOVA

BIONUMERICS offers a generalized and well-documented implementation of ANOVA (Analysis of Variance) and MANOVA (Multivariate Analysis of Variance) with comprehensive statistical analysis and validation testing tools. These very useful statistical methods allow you to investigate the relation between groups of entries and characters, as well as the significance of such groups. The groups can be clusters derived from a dendrogram, or any user-defined selections of entries (e.g., by origin, species, serotype …).

Audit trails and versioning

Enables all changes to any database object in BIONUMERICS to be recorded and versioned in audit trails. Trailing strength ranges from logging only to full tracking. In full tracking mode, all previous versions of objects are automatically stored including time and user data. Audit trails can be viewed for particular objects, classes of objects or all audit-trailed objects. Previous versions of an object can optionally be restored.

Band matching analysis

Multiple alignments of patterns can be obtained by conducting a global band matching, a process that subdivides all bands from a set of patterns into band classes. Band matching has the advantage that data matrices can be generated containing the band classes as characters, which can be applied in a number of phylogenetic and statistical techniques that require a character table as input. Global band matching is calculated in the Comparison window from any selection of patterns.

Circular dendrogram visualization

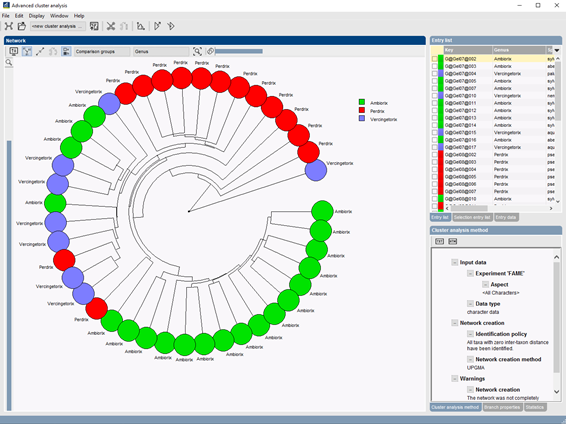
In the Advanced cluster analysis window, a dendrogram layout option is available that allows you to create a circular dendrogram of your data.

Circular dendrogram

Flexible dendrogram display settings

Adjustments to taxon and label colors can be specified and moreover, the phylogenetic tree can be annotated with various types of data available in the BIONUMERICS database.

Classifiers

Classifiers are the algorithms that perform identification or classification, i.e. the process of assigning biological samples to classes (categories) based on a training set of which the class membership is already known. The samples are analyzed based on experimental data, which can be quantitative, binary or categorical.

Cluster significance tools

In addition to standard methods such as bootstrap analysis or cophenetic correlation, BIONUMERICS employs proprietary technology to assess the reliability of clusters for any clustering algorithm and data set. The method is based on resampling/permutation techniques operating at the data level or at the similarity level and is designed as a framework encompassing all available clustering algorithms in BIONUMERICS.

Comparative genomics tools

BIONUMERICS lets you align and compare sequences of up to full chromosome length. Discontinuous alignments are calculated using seed and stretch-based sequence mapping, revealing genomic inversions, swaps, duplications, insertions and deletions. Mutation and SNP discovery can be performed on template-based multiple chromosome alignments, with optional selection of mutation type (intergenic, synonymous, non-synonymous or indel) and filtering of significant SNPs based on quality scores. dNdS analysis based on the ratio synonymous/non-synonymous mutations within gene clusters is available to predict evolutionary selection pressure on genes.

Composite clustering

Data from multiple techniques can be combined into one composite clustering. Similarities can be adopted from the individual experiments and averaged using different weighting strategies. Alternatively, all characters from the individual experiments can be pooled to form one global data set, which can be clustered. Using a mathematical linearization model, a consensus similarity matrix and dendrogram can be calculated based upon individual matrices from different experiments.

Customized display of test panels

Character profiles can be displayed in a panel with user-defined representations and color scales or in a list with values. The character display tools in BIONUMERICS are very flexible, resulting in a truthful image of all test results, be it from a commercially available test panel (e.g. Biolog plates, bioMérieux' API strips), DNA or microarray, microplate assay (e.g. ELISA tests in 96 or 384 well plate format) or any standard biochemical test.

Database screening

Entire BIONUMERICS databases or selections thereof can be screened using fast matching algorithms to identify batches of entries based on fingerprint, character or sequence experiments. All available similarity or distance coefficients can be used for the fast screening. Matching entries are arranged by decreasing distance with the unknowns and can be selected for further comparison e.g. using cluster analysis.

Decision networks

Decision networks allow automated workflows to be built that make decisions, predict features, perform queries, fill in fields, create graphs and plots, etc. They can be used for resistance prediction, in breeding research, for complex reporting or for automated analysis of multilevel and polyphasic data analysis and data sorting. It includes the option to build bifurcating decision trees.

Digital signatures

Secure digital signature key pairs can be used by authorized users to sign and validate final processed data entries and/or any further changes made. Checks for the validity of digital signatures and for any fraudulent changes made to the data after digitally signing.

Distance and similarity matrices

An externally generated distance matrix or similarity matrix can be imported and linked to database entries in a BIONUMERICS database. This is used in conjunction with other information to obtain classifications and identifications. The distance or similarity values are either measured directly by the technique (a typical example being DNA-DNA hybridization values in bacterial taxonomy), or generated by other software.

Genome annotation

Unannotated or partially annotated sequences can be annotated against one or multiple reference chromosomes. For each annotated ORF, all possible choices are listed according to feature identity and chromosome synteny. Similar features can be clustered according to identity. The user can manually override annotations made by the software.

Identification projects

Creation of identification projects based on comparisons. Specific similarity measures and classifiers can be defined based on experimental data. Comprehensive identification reports showing results for each available experiment. Many different viewing options and statistical tools to facilitate interpretation.

MALDI-TOF analysis

The Spectrum type experiment type provides a comprehensive platform for importing, preprocessing and summarizing spectrum fingerprints obtained by e.g. Matrix-Assisted Laser Desorption/Ionization Time-Of-Flight Mass Spectrometry (MALDI TOF MS), Liquid Chromatography – Mass Spectrometry (LC MS), ElectroSpray Ionization (ESI), etc.

Minimum Spanning Trees

The Minimum Spanning Tree (MST) algorithm allows short-term divergence and micro-evolution in populations to be reconstructed based upon sampled data. The MST technique as implemented in the BIONUMERICS software is an excellent tool for analyzing genetic subtyping data such as derived from MLST, MLVA and other allele-comparison techniques.

Multi-Dimensional Scaling (MDS)

Multi-Dimensional Scaling (MDS), sometimes also called Principal Coordinates Analysis (PCoA), is a non-hierarchic grouping method. Rather than starting from the data set as Principal Components Analysis (PCA) does, MDS uses the similarity matrix as input, which has the advantage over PCA that it can be applied directly to pairwise-compared banding patterns.

Multiple sequence alignment

BIONUMERICS offers probably the finest and most comprehensive multiple sequence alignment tool that currently exist for PCs. It combines clustering of thousands of nucleotide or protein sequences of almost unlimited length with multiple alignment and display of homology matrices.

Open reading frame analysis

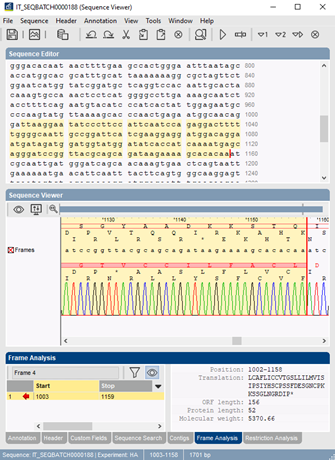
Frame analysis finds all open reading frames (ORF) and predicts protein coding sequences (PCS) on a sequence. The open reading frame finder in BIONUMERICS lists all ORFs and possible PCS regions for all six translation frames, for a given translation table and codon usage table. The user can specify an optional ORF and PCS length filter. ORFs and amino acid translations can be plotted on a graphical sequence display.

ORF prediction in the BIONUMERICS software

Partition mapping

Partition mapping analyzes the correspondences between two partitions (classifications) and produces a number of mapping rules that define the significantly pairing groups between the two sets. The BIONUMERICS partition mapping tool is very useful for analyzing the congruences and discrepancies between typing and classification techniques and for defining reliable and consistent groups on the basis of multiple classification methods.

Peak quantification

Band-search algorithms with adjustable sensitivity for shoulder and double-band finding. Possibility to find and mark uncertain bands/peaks. Quantification of molecular sizes or any other metric unit using linear, logarithmic, combined logarithmic-third power regression, cubic spline or pole functions. Accurate expression of protein or nucleic acid quantities or concentrations based on cubic spline regression using known calibration peaks. Comparative quantification of bands/peaks between groups of patterns.

Phylogenetic tree construction

BIONUMERICS offers phylogenetic tree construction methods such as Maximum Parsimony and Maximum Likelihood. Besides standard algorithms, the optimal trees can be calculated using simulated annealing or quartet puzzling. Both methods result in an unrooted tree, which can be converted into a rooted tree after assignment of a root. To correct phylogenetic distance scaling, the Jukes & Cantor or Kimura 2 parameter correction factors can be chosen.

Primer design

The PCR primer design tool in the BIONUMERICS software searches for optimal primers or primer combinations for the most diverse experiment setups by taking into account a large number of experimental parameters. The user can specify various primer properties such as preferential length and melting temperature, %GC boundaries, maximal degeneracy, etc. Forward and reverse primers and PCR combinations can be sorted and selected according to different parameters (position, melting temperature, length, degeneracy, %GC...). Selected primer pairs can be stored in the oligonucleotide database.

Principal Components Analysis (PCA) and Discriminant Analysis

Principal Components Analysis (PCA) starts directly from a character table to obtain non-hierarchic groupings in a multi-dimensional space. Any combination of components can be displayed in two or three dimensions. Discriminant analysis is very similar to PCA. The major difference is that PCA calculates the best discriminating components without foreknowledge about groups, whereas discriminant analysis calculates the best discriminating components (= discriminants) for groups that are defined by the user.

Restriction enzyme analysis

In-silico multi-purpose analysis of restriction enzyme cleavage suitable for cloning experiments as well as for RFLP, PFGE and AFLP design. Thousands of restriction enzymes from ReBase can be downloaded and stored, and subsets of enzymes of particular interest can be created (e.g. 4-cutters, blunt-cutters, cheap enzymes, available enzymes...). Up to full chromosomes can be analyzed so that optimal enzymes can be selected for electrophoresis-based fragment typing techniques.

Self-Organizing Maps (SOM)

Basically being a type of neural network, a Self-Organizing Map (SOM) or Kohonen map is able to place many thousands of entries in a two-dimensional representation, according to overall relatedness. For complex data sets with large numbers of entries, SOM analysis can be the preferred grouping tool. An interesting option of a SOM is that unknown entries can be placed in an existing map with very little computing time, which offers a quick and easy-to-interpret classification tool. BIONUMERICS has been the first software to apply this exciting technique for biological data.

Statistical tests and charts

A number of parametric and non-parametric statistical tests can be performed in an easy and intuitive environment (Chi-square test, T-test, Wilcoxon signed-ranks test, Kruskal-Wallis test, ANOVA, Pearson correlation test, Spearmann rank-order test. Automatic display of available tests for each input data type. Kolgomorov-Smirnov test for normality. Clear significance reporting.

User management

Comprehensive set of user and security tools, including creation of Users with logins and passwords and User Groups defining specific privileges. Control password timeout and strength, user activity logging and data input consistency. Possibility to define access privileges for each individual database object. Create, Modify, Delete, Sign, Restore, Lock and Unlock privileges can be granted to specific users. ODBC connection string can optionally be encrypted to enhance database security. To ensure even higher security, the entire database connection and mapping settings file can be encrypted as well.